October 31, 2022
IT Spending Updates: Green Lights and Data Gaps

The latest updates for federal information technology (IT) program budgets show increases in total dollars dedicated for FY22 and planned for FY23. The data also shows ongoing problems with reporting. This analysis looks at government-wide trends and highlights changes at Health and Human Services (HHS) and the Department of Transportation (DOT).
The federal IT Dashboard offers the only government-wide look at IT acquisitions for federal agencies. Now managed by the Government Services Administration (GSA), it launched in 2009 and was modernized in 2022. As GSA Administrator Carnahan stated at the re-launch on March 21, “The new federal IT dashboard is a significant milestone in a more than decade-long effort to provide greater transparency and accountability around federal IT modernization. As federal agencies make critical investments in upgrading their IT infrastructure and improving digital service delivery, it’s vital for the public to have visibility into how these dollars are being spent.”
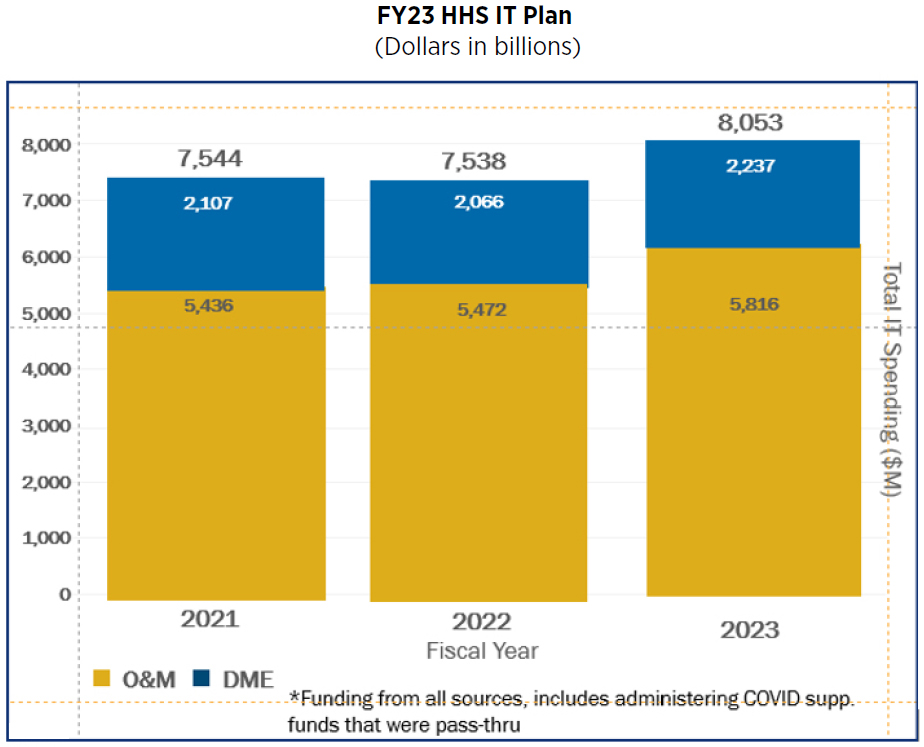
Chart I: HHS FY23 IT Spend, IT Dashboard 3/16/2022
Each Department is required to submit data into the Dashboard, which is used by the Office of Management and Budget (OMB) to meet statutory collection and reporting obligations. However, there are still challenges with timeliness and inconsistency. While the IT Dashboard states it is “transforming the Federal IT Data collection into a coherent, modularized ecosystem,” that goal is not a reality. Comparing IT Dashboard data to information reported by agencies or OMB is difficult. For example, FY23 IT Dashboard Department totals reported on March 16, do not match data OMB featured in the “Information Technology” summary in the Analytical Perspectives of Biden’s FY23 Budget, finalized March 28. Those discrepancies limit our analysis to IT Dashboard data.
For FY23, the Dashboard reports $81.0 billion of planned IT spend for 26 Departments or agencies. The total includes IT investments in various categories: Operations and Maintenance vs. Development, Modernization & Enhancement (DME) projects; Major and non-major acquisitions, Low (44%), medium (53%), and high-risk (3%) projects (as determined by Department CIOs); IT Towers and Cost Pools; Schedule and Cost Variance; and Mission Support.
Both the timeliness and precision of IT Dashboard data vary significantly by department. For example, all agencies reported data for planned FY23 IT spend in March 2022. Many departments, including the Departments of Health and Human Services (HHS) and Justice (DOJ) updated FY23 numbers at the close of FY22, during the last week of September. Their updates include significant changes that we will highlight. Others, such as Education, Homeland, and Veterans Affairs, made minimal or no updates.
In the “re-branded” IT Dashboard, the most impactful measures are the ones agencies actually use. Compliance with dashboard categories remains spotty. For example, in the Mission Support portfolio, HHS reports $5.8 billion in FY23 spending as “not applicable” to any of the categories. More consistently employed across government IT (as well as the private sector) are the IT Towers categories defined through industry’s Technology Business Management (TBM) taxonomy: Applications; Compute, Data Centers; Delivery, End Use, IT Management; Network; Platform; Security and Compliance; Storage; and Output.
HHS FOCUS: BIGGER PIE STILL SUPPORTS A 7% INCREASE IN IT SPEND
Concurrent with the March release of the President’s budget, the IT Dashboard reported the FY23 HHS IT plan to be $8.05 billion, a $515M, (+6.8%), increase over FY22 levels, as seen below in Chart I. Within that total, O&M projects are expected to be $5.8B for FY23 (+$344 million), and DME projects are $2.2B (+$171 million).
IN SEPTEMBER, HHS PIES GREW
HHS made a substantial number of year-end FY22 IT Dashboard updates, increasing both their FY22 and FY23 IT totals. FY22 increased to $8.017 billion from $7.538 billion and FY23 increased to $8.576 billion from $8.053 billion (IT Dashboard data as of 9/30/2022). Each of those “pies” exceed the March IT Dashboard totals by over 6%. And the revised totals, even with the larger FY22 base, still support a 7% increase from FY22 to FY23.
HHS doubles down on Security and Compliance funding in the FY23 spending plan, as illustrated in Chart II. In March, HHS planned
$953 million for S&C projects, but the September update shows $1.232 billion in S&C spend, a 29% increase. A few factors are at play: the Biden Administration’s focus on cybersecurity in general; OMB’s direction to prioritize zero trust initiatives, including encouragement to reprogram funds, and the late FY22 appropriation that led to an end-of-year scramble. We suspect the continuing resolution prohibition on new starts encouraged agencies to fund large S&C buckets rather than detailed program lines.
The effect of the Inflation Reduction Act on HHS IT, including the $3 billion provided for Centers for Medicare and Medicaid to administer drug price negotiation activities, is not yet determined and may increase reported FY23 totals.
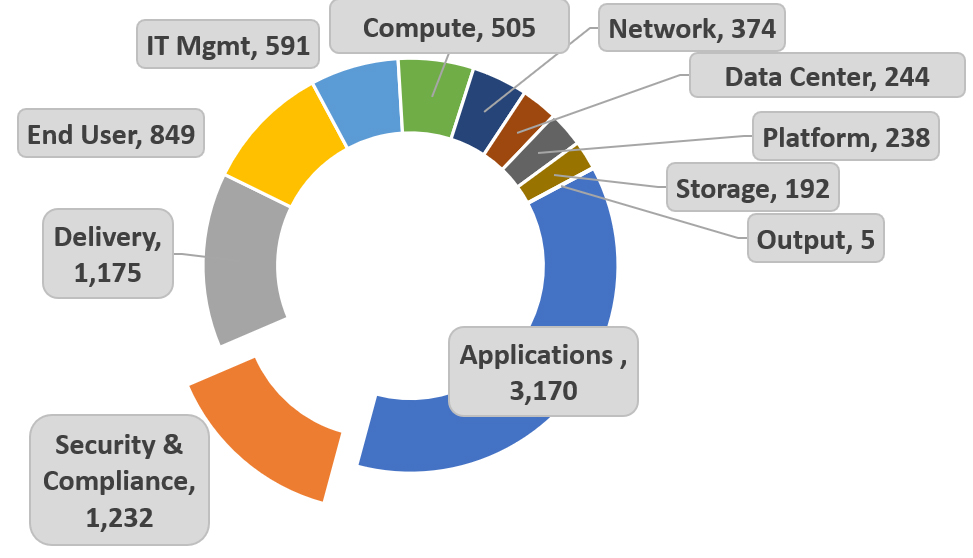
Chart II: HHS FY23 IT Portfolio by IT Tower, Dollars in millions
FOCUS ON DOT: BIG INCREASES SINCE MARCH
Another Department with big increases since the March 2022 IT Dashboard data run is DOT, which reported $3.053 billion FY23 IT spend in March, and updated that to $3.870 billion in September—an increase of $817 million (+27%). The major impetus for that change is that DOT is the administrator for most of the $1.2 trillion made available by the Infrastructure Investment and Jobs Act (IIJA)/Bipartisan Infrastructure Law funding. Even for the funds that will pass through DOT to states and other entities, the Department is allowed to retain funding for administrative purposes, which include set-up and modernization of IT infrastructure to assure proper distribution, oversight, monitoring, and compliance.
DOT’s revised FY23 numbers increased all IT Tower programs, but the largest increases were for Applications (+$135 million), Compute (+$76 million) and IT Management (+$92 million).
OTHER INCREASES
Looking across government, other departments showed big IT increases in their September data updates. Those include the Departments of Justice (from $3.65 billion to $4.08 billion); Agriculture (from $3.2 billion reported for IT Towers, which did not match its $2.9 billion summary, to $4.20 billion); and State ($2.22 billion to $3.20 billion). The factors contributing to these increases likely include a mix of the effect of late FY22 enactment; OMB prioritization of IT, especially cybersecurity; and IT to support program delivery and compliance for programs funded by IIJA and the Inflation Reduction Act.
UNCERTAINTY AHEAD
The signals for FY23 IT spend based on the most recent agency updates are extremely promising, but in FBIQ’s view overly optimistic. As of September 30, every Department is set to maintain or increase spend from March estimates, some escalating by 27-31%. Many are focusing new funding on cybersecurity. Although the IT Dashboard is only one data source, agencies have worked out several reporting kinks leading to steadily improving data. Data quality aside, there is significant political uncertainty this fall due to the political climate. In FY22, Congress approved roughly half of the total non-defense spending increases proposed in Biden’s FY22 Budget. The outcome of the mid-term elections, when combined with economic trends (including inflation) will likely affect overall budgets, including for information technology, as appropriators negotiate the FY23 spending bills in the closing days of the 117th Congress.